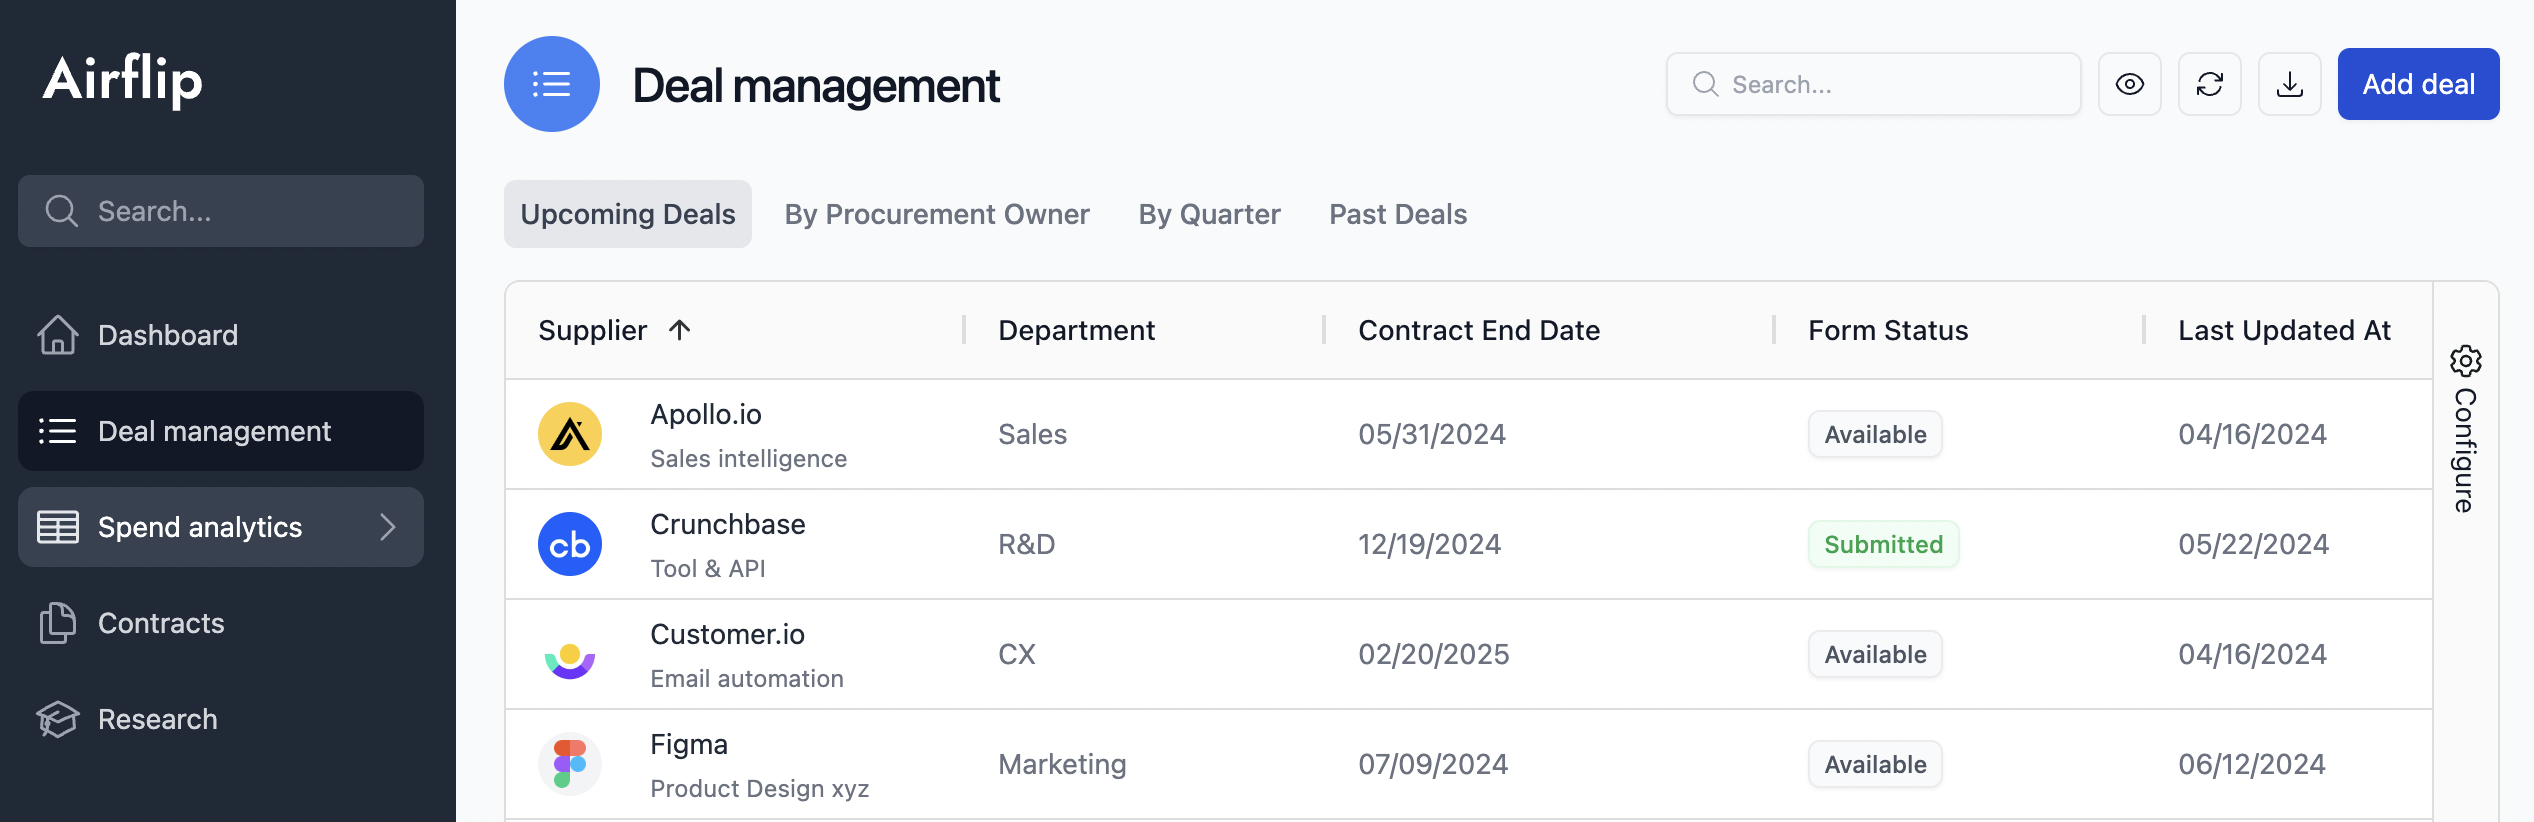
Sorting
The dashboard supports sorting by date, number, and text. This feature enables you to organize your supplier deals in a way that best suits your needs, whether you want to view the most recent deals first, sort by the contract amount, or alphabetically by supplier name. To sort a column:- Single Click on the column header to sort in ascending order.
- Click again on the same column header to sort in descending order.
- Click again on the same column header to remove the sort.
Filtering
Our multi-filter approach allows you to combine different filter types across any of your selected columns. This is particularly useful for narrowing down your view to specific deals based on various criteria, such as deal status, supplier category, or any other relevant data point. Airflip supports filtering across dates, text, and numbers.Dates
- Access the Filter: Click the filter icon next to the date column you want to refine.
- Select Your Criteria: Choose from options like “equals,” “before,” “after,” and more to narrow down your dates. You can even select “blank” or “not blank” to filter based on empty or filled fields.
- Combine Filters (Optional): Need to narrow it down further? Add another filter to the same column and decide whether to use “AND” (both conditions must be met) or “OR” (either condition works).
Text
- Access the Filter: Click the filter icon in your desired text column.
- Select Your Criteria: Check the boxes for the text values you want to appear. You can select multiple boxes; this works like an “OR” filter, showing rows that match any of your chosen values.
Numbers
- Access the Filter: Click the filter icon in the column with numbers.
- Select Your Criteria: Pick from options like “greater than,” “less than,” “equals,” and more to filter your number column. “Between” is great for specifying a range, and “blank” or “not blank” helps filter based on empty or filled cells.
- Combine Filters (Optional): For even more precision, add a second filter on the same column. Decide if you want both conditions to apply (“AND”) or just one (“OR”).
Grouping and Aggregation
Grouping allows you to organize your deals by categories such as Department or Vendor name.- To group your deals, drag and drop any column header into the grouping area above the table, or expand the column selector on the right-hand side of the table and drag any column to the Row Group area.
- When you group data, our dashboard provides the option to aggregate information within each group. This means you can see sums, averages, counts, or other aggregate functions applied to numerical data, providing a quick overview of the metrics that matter most to your procurement processes.
- To aggregate your grouped data, expand the column selector on the right-hand side of the table and drag any numeric column to the Values area. Make sure to select the type of aggregation you would like to see, such as “sum,” “average,” etc.
Pinning Columns
To ensure you always have access to the most critical data, our dashboard allows you to pin columns. Pinned columns remain visible on the screen as you scroll horizontally, making it easier to reference key information while reviewing other data.- To pin a column, click on the column header you wish to pin and drag it to the left or right of the page. When you see the pin icon, drop the column, and it will be successfully pinned.
Column Selection
Customize your view by selecting which columns to display on the dashboard. This feature allows you to focus on the data that is most relevant to your current needs, ensuring a streamlined and efficient workflow.- Expand the vertical column selector on the right side of the table and select or deselect columns from your view. You can also drag and drop items in this list to change their order.